What is a spectrogram?
A spectrogram represents an audio signal (here a ULF/VLF radio wave converted to sound) across three dimensions at once: time on the horizontal axis, frequency on the vertical axis, and the intensity of the signal at each instant and each frequency, shown by colour. The brighter or more vivid an area, the stronger the signal at that precise moment and frequency.
This tool is what lets you tell a simple electrical hum apart from a genuine natural event: a sferic, a tweek or a whistler each has a characteristic visual signature, instantly recognisable once you know what to look for.
Recognising sferics, tweeks and whistlers
sharp vertical streaks, all frequencies at once
vertical streak, small hook around 1.7–1.8 kHz
a few tens of ms
long curve that flattens out
~1–2 s, sometimes more
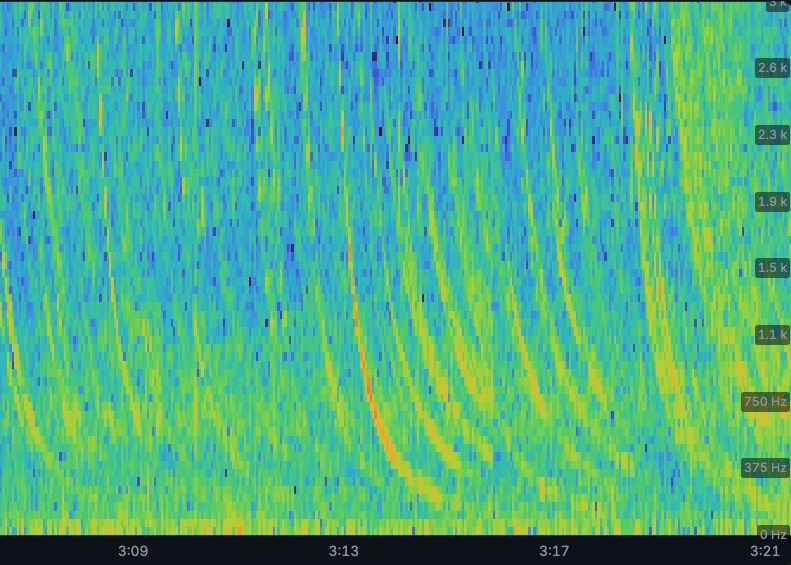
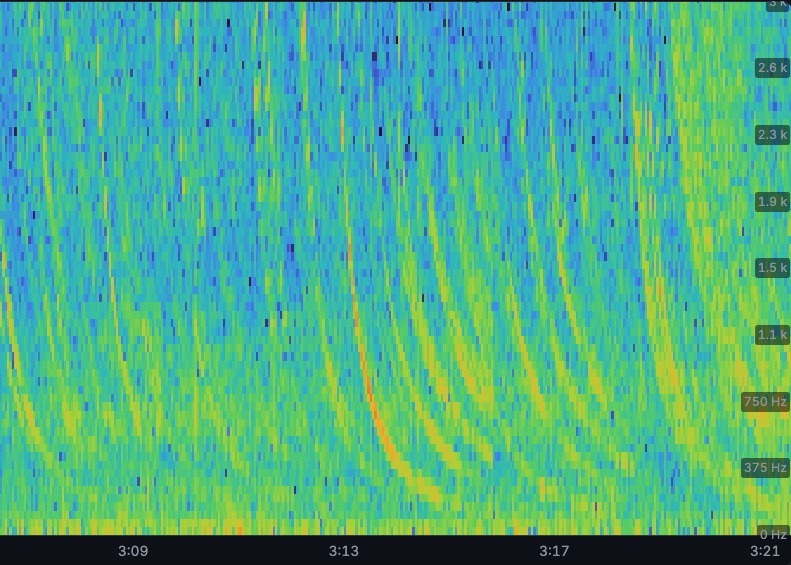
several successive whistlers
The sferic is the raw pulse of the lightning strike itself: all frequencies arrive almost simultaneously, hence this sharp vertical streak. As the natural radio wave travels further, it disperses slightly at the very lowest frequencies and picks up a small hook: this is the tweek. The size of this hook varies with the ionospheric conditions at the time, sometimes subtle, sometimes more pronounced. If the energy escapes into the magnetosphere and comes back down after a very long path, the dispersion becomes massive: the high frequencies arrive first (an almost vertical streak), then progressively lower frequencies arrive with increasing delay, drawing a long curve that flattens and stretches out over time — this is the whistler, a signature of space weather, shaped like a "hockey stick".
Player controls
- FullscreenEnlarges the spectrogram to more easily spot fine details, especially useful on mobile.
- Centre on 0–3 kHzNarrows the frequency axis to the band where most sferic/tweek activity is concentrated, zooming the display onto this range.
- Half resolution (FFT 1024) / full resolution (FFT 2048)An unavoidable physical trade-off: full resolution distinguishes nearby frequencies better but smooths out very brief events, while half resolution does the opposite, better defining the start and end of a pulse. For sferics (very short events), half resolution is often preferable.
- Colour paletteOnly changes the visual rendering (Inferno and Viridis are designed to remain readable even for colour-blind viewers; Greyscale is useful for judging raw contrast without colour distraction).
- Temporal smoothingThe lower the value, the more sharply clicks and pulses stand out (at the cost of a "jumpier" display); the higher it is, the more stable and readable the image, but brief events lose sharpness.
- Range (dB)Small button that unfolds a thin vertical slider: sets the floor of the displayed contrast. The lower (more negative) the value, the more sensitive the display becomes to weak signals.
- GainA second slider right next to it: below 1, brightens weak signals (the tail of a click, a subtle whistler); above 1, emphasises only the already-strong peaks.
- Frequency axis: linear / log (Lin/Log)Switches the vertical axis to a logarithmic scale, which stretches out low frequencies and compresses high ones. Useful for better distinguishing the Dawn Chorus, Hiss and some whistlers, whose interesting detail is often concentrated in the lower part of the spectrum. Linear by default.
- Time window (displayed duration)Sets how many seconds are visible on screen at once. A short window stretches out each event (more visible detail), a long window gives an overview of storm activity.
- Zoom on an areaOnce playback is paused, select an area of the spectrogram with your mouse (or finger) to zoom in; double-click or click the zoom badge to return to the normal view.
- Transient zoom (right-click)Right-click anywhere on the spectrogram, or on one of the small markers just below it (automatically detected at the most notable moments in the file), to open a very high time-resolution zoom on that exact instant — useful for seeing the fine structure of a sferic or a tweek too fast to make out at the normal scale. A button then lets you download the image.
Removing noise and electrical interference in VLF
A thin, continuous horizontal band, often around 50 Hz and its harmonics (100, 150, 200 Hz...), almost always corresponds to the mains electrical grid rather than a natural phenomenon. It's the most common source of interference on this type of recording, and even more noticeable when the antenna was close to a power distribution network or an electronic device.
Audio processing
For those interested, when needed I apply audio processing consisting of a DNR filter (dynamic noise reduction) combined with an STFT notch, complemented by a classic notch filter for the most stubborn tonal lines.
DNR: digital noise reduction. Handles broadband background noise.
STFT notch: a band-stop filter applied in the time-frequency domain (via the short-term Fourier transform), able to precisely target a tonal line even if it drifts slightly in frequency. Ideal for the 50 Hz mains hum and its harmonics.
Classic notch: used as a supplement, for the most stubborn lines that resist STFT processing (a simple fixed filter, as a last resort, on one precise frequency).
Back to player